YiGraph Installation and Usage Guide
This document introduces the environment preparation, installation steps, configuration methods, and basic usage of the YiGraph project.
1. Environment Preparation
1.1 Python Version Requirements
- Python >= 3.11
Please confirm that your current Python version meets the requirements:
python --version
# or
python3 --version
1.2 Create Virtual Environment with Conda (Recommended)
conda create -n AAG python=3.11
conda activate AAG
1.3 Neo4j Installation and Configuration
YiGraph requires Neo4j as the graph database. This guide uses Neo4j 3.5.25.
1.3.1 Java Version Requirements
Neo4j 3.5.25 requires Java 8 or Java 11. Please check your Java version:
java -version
If Java is not installed, please install the appropriate version first.
1.3.2 Download and Extract Neo4j
- Download the Neo4j 3.5.25 installation package from the official website (usually in
.tar.gzor.zipformat) - Extract the package to your desired location:
Linux/Mac systems (.tar.gz format):
tar -xzf neo4j-community-3.5.25-unix.tar.gz
cd neo4j-community-3.5.25
Windows systems (.zip format):
- Right-click the archive and select "Extract to current folder"
- Or use command:
unzip neo4j-community-3.5.25-windows.zip - Navigate to the extracted directory
1.3.3 Configure Neo4j
Enter the conf directory and edit the neo4j.conf file with the following configurations:
cd conf
Add or modify the following settings in neo4j.conf:
dbms.connectors.default_listen_address=0.0.0.0
dbms.connectors.default_advertised_address=localhost
dbms.connector.bolt.listen_address=0.0.0.0:7687
dbms.connector.http.listen_address=0.0.0.0:7474
dbms.connector.https.enabled=true
1.3.4 Start and Stop Neo4j
Navigate to the bin directory to start or stop Neo4j:
Start Neo4j:
cd bin
./neo4j start
Stop Neo4j:
./neo4j stop
After starting Neo4j, you can access the web interface at http://localhost:7474 to verify the installation.
2. Get Source Code and Install Dependencies
2.1 Download Source Code
git clone https://github.com/iDC-NEU/YiGraph.git
cd YiGraph
2.2 Install Dependencies
pip install -r requirements.txt
3. System Configuration
This section describes how to configure the LLM reasoning engine, retrieval modules (Milvus + Neo4j), and dataset loading.
3.1 Configure Reasoning and Retrieval Engine
Edit the configuration file:
config/engine_config.yaml
1️⃣ LLM (Reasoning Module) Configuration
The system supports two LLM providers:
ollama(locally deployed models)openai(OpenAI or OpenAI-compatible APIs such as DeepSeek or self-hosted services)
Example configuration:
reasoner:
  llm:
    # LLM provider: ollama (local) or openai (OpenAI-compatible API)
    provider: "openai"

    # Ollama config (used when provider = ollama)
    ollama:
      model_name: "llama3.1:70b"
      device: "cuda:0"
      timeout: 150000
      port: 11434

    # OpenAI-compatible API (used when provider = openai)
    openai:
      base_url: "https://your-api-endpoint/v1/"   # Must end with "/"
      api_key: "your-api-key"
      model: "gpt-4o-mini"
Parameter Description
| Parameter | Description |
|---|---|
| provider | Select LLM backend: ollama or openai |
| model_name | Local Ollama model name |
| device | GPU device ID (e.g., cuda:0) |
| timeout | Inference timeout (milliseconds) |
| base_url | OpenAI-compatible API endpoint (must end with /) |
| api_key | API key |
| model | Model name |
⚠ When using an OpenAI-compatible API (e.g., DeepSeek or a self-hosted service), ensure the
base_urlis correct and ends with/.
2️⃣ Retrieval Configuration (Vector + Graph)
The system supports:
- Milvus for vector-based RAG retrieval
- Neo4j for graph-based querying
Example configuration:
retrieval:
  database:
    # Vector database (Milvus)
    vector:
      host: "localhost"
      port: 19530

    # Graph database (Neo4j)
    neo4j:
      enabled: true
      uri: "bolt://localhost:7687"
      user: "neo4j"
      password: "your-password"

  # Embedding model configuration
  embedding:
    model_name: "BAAI/bge-large-en-v1.5"
    batch_size: 20
    chunk_size: 512
    chunk_overlap: 20
    device: "cuda:2"
Milvus (Vector Database)
| Parameter | Description |
|---|---|
| host | Milvus server address |
| port | Milvus service port |
Ensure that Milvus is running before starting the system (Docker deployment is recommended).
Neo4j (Graph Database)
| Parameter | Description |
|---|---|
| enabled | Whether to enable Neo4j |
| uri | Bolt protocol URI |
| user | Database username |
| password | Database password |
If graph functionality is not required, set
enabledtofalse.
Embedding Model
| Parameter | Description |
|---|---|
| model_name | HuggingFace embedding model name |
| batch_size | Embedding batch size |
| chunk_size | Text chunk size |
| chunk_overlap | Overlapping tokens between chunks |
| device | GPU device ID |
3.2 Configure Dataset
Edit the configuration file:
config/data_upload_config.yaml
The system supports two dataset types:
graphtext
Graph Dataset Example (AMLSim1K)
datasets:
  - name: AMLSim1K
    type: graph
    description: "AMLSim 1K synthetic transaction graph."

    schema:
      # -----------------------------
      # Vertex Layer
      # -----------------------------
      vertex:
        - type: account
          path: "aag/datasets/graphs/transaction_amlsim/1K/accounts.csv"
          format: csv
          id_field: acct_id
          label_field: prior_sar_count   # Optional

      # -----------------------------
      # Edge Layer
      # -----------------------------
      edge:
        - type: transfer
          path: "aag/datasets/graphs/transaction_amlsim/1K/transactions.csv"
          format: csv
          source_field: orig_acct
          target_field: bene_acct
          label_field: is_sar            # Optional

      # -----------------------------
      # Graph-Level Settings
      # -----------------------------
      graph:
        directed: true
        multigraph: true
        weighted: false
        heterogeneous: false
Parameter Description
Basic Information
| Parameter | Description |
|---|---|
| name | Dataset name |
| type | Dataset type: graph or text |
| description | Dataset description |
Vertex Configuration
| Parameter | Description |
|---|---|
| type | Node type |
| path | Path to data file |
| format | File format (csv, json, yaml, gml) |
| id_field | Unique node ID field |
| label_field | Node label field (optional) |
Edge Configuration
| Parameter | Description |
|---|---|
| type | Edge type |
| path | Path to data file |
| source_field | Source node field |
| target_field | Target node field |
| label_field | Edge label field (optional) |
Graph-Level Configuration
| Parameter | Description |
|---|---|
| directed | Whether the graph is directed |
| multigraph | Whether multiple edges are allowed |
| weighted | Whether edges are weighted |
| heterogeneous | Whether the graph is heterogeneous |
⚠ Notes
-
Update all
pathfields to match your local dataset paths. -
Ensure the following services are running before launching the system:
- Milvus
- Neo4j (if enabled)
- GPU devices are available (if required)
-
When using remote LLM APIs, ensure network connectivity is available.
4. Start YiGraph
Important Note: Before starting YiGraph, please ensure that the Neo4j database is already running. If Neo4j is not started, YiGraph will not be able to connect to the graph database. Please refer to 1.3.4 Start and Stop Neo4j to start Neo4j.
YiGraph supports the following two running modes:
-
Web Interactive Mode (Recommended)
Interactive analysis through a browser, suitable for daily use, demonstrations, and business analysis scenarios. -
Terminal Interactive Mode
Interaction through command line, suitable for development debugging, quick verification, and batch testing scenarios.
4.1 Web Interactive Mode
Execute the following command in the project root directory to start the web service:
python web/frontend/run.py
After successful startup, the terminal will output the accessible service address. Please open the corresponding address in your browser according to the prompt to enter the YiGraph web interface.
In the web interface, users can input business questions in natural language, and the system will automatically complete the analysis process and display analysis results and reports.
Web Interface Usage Guide
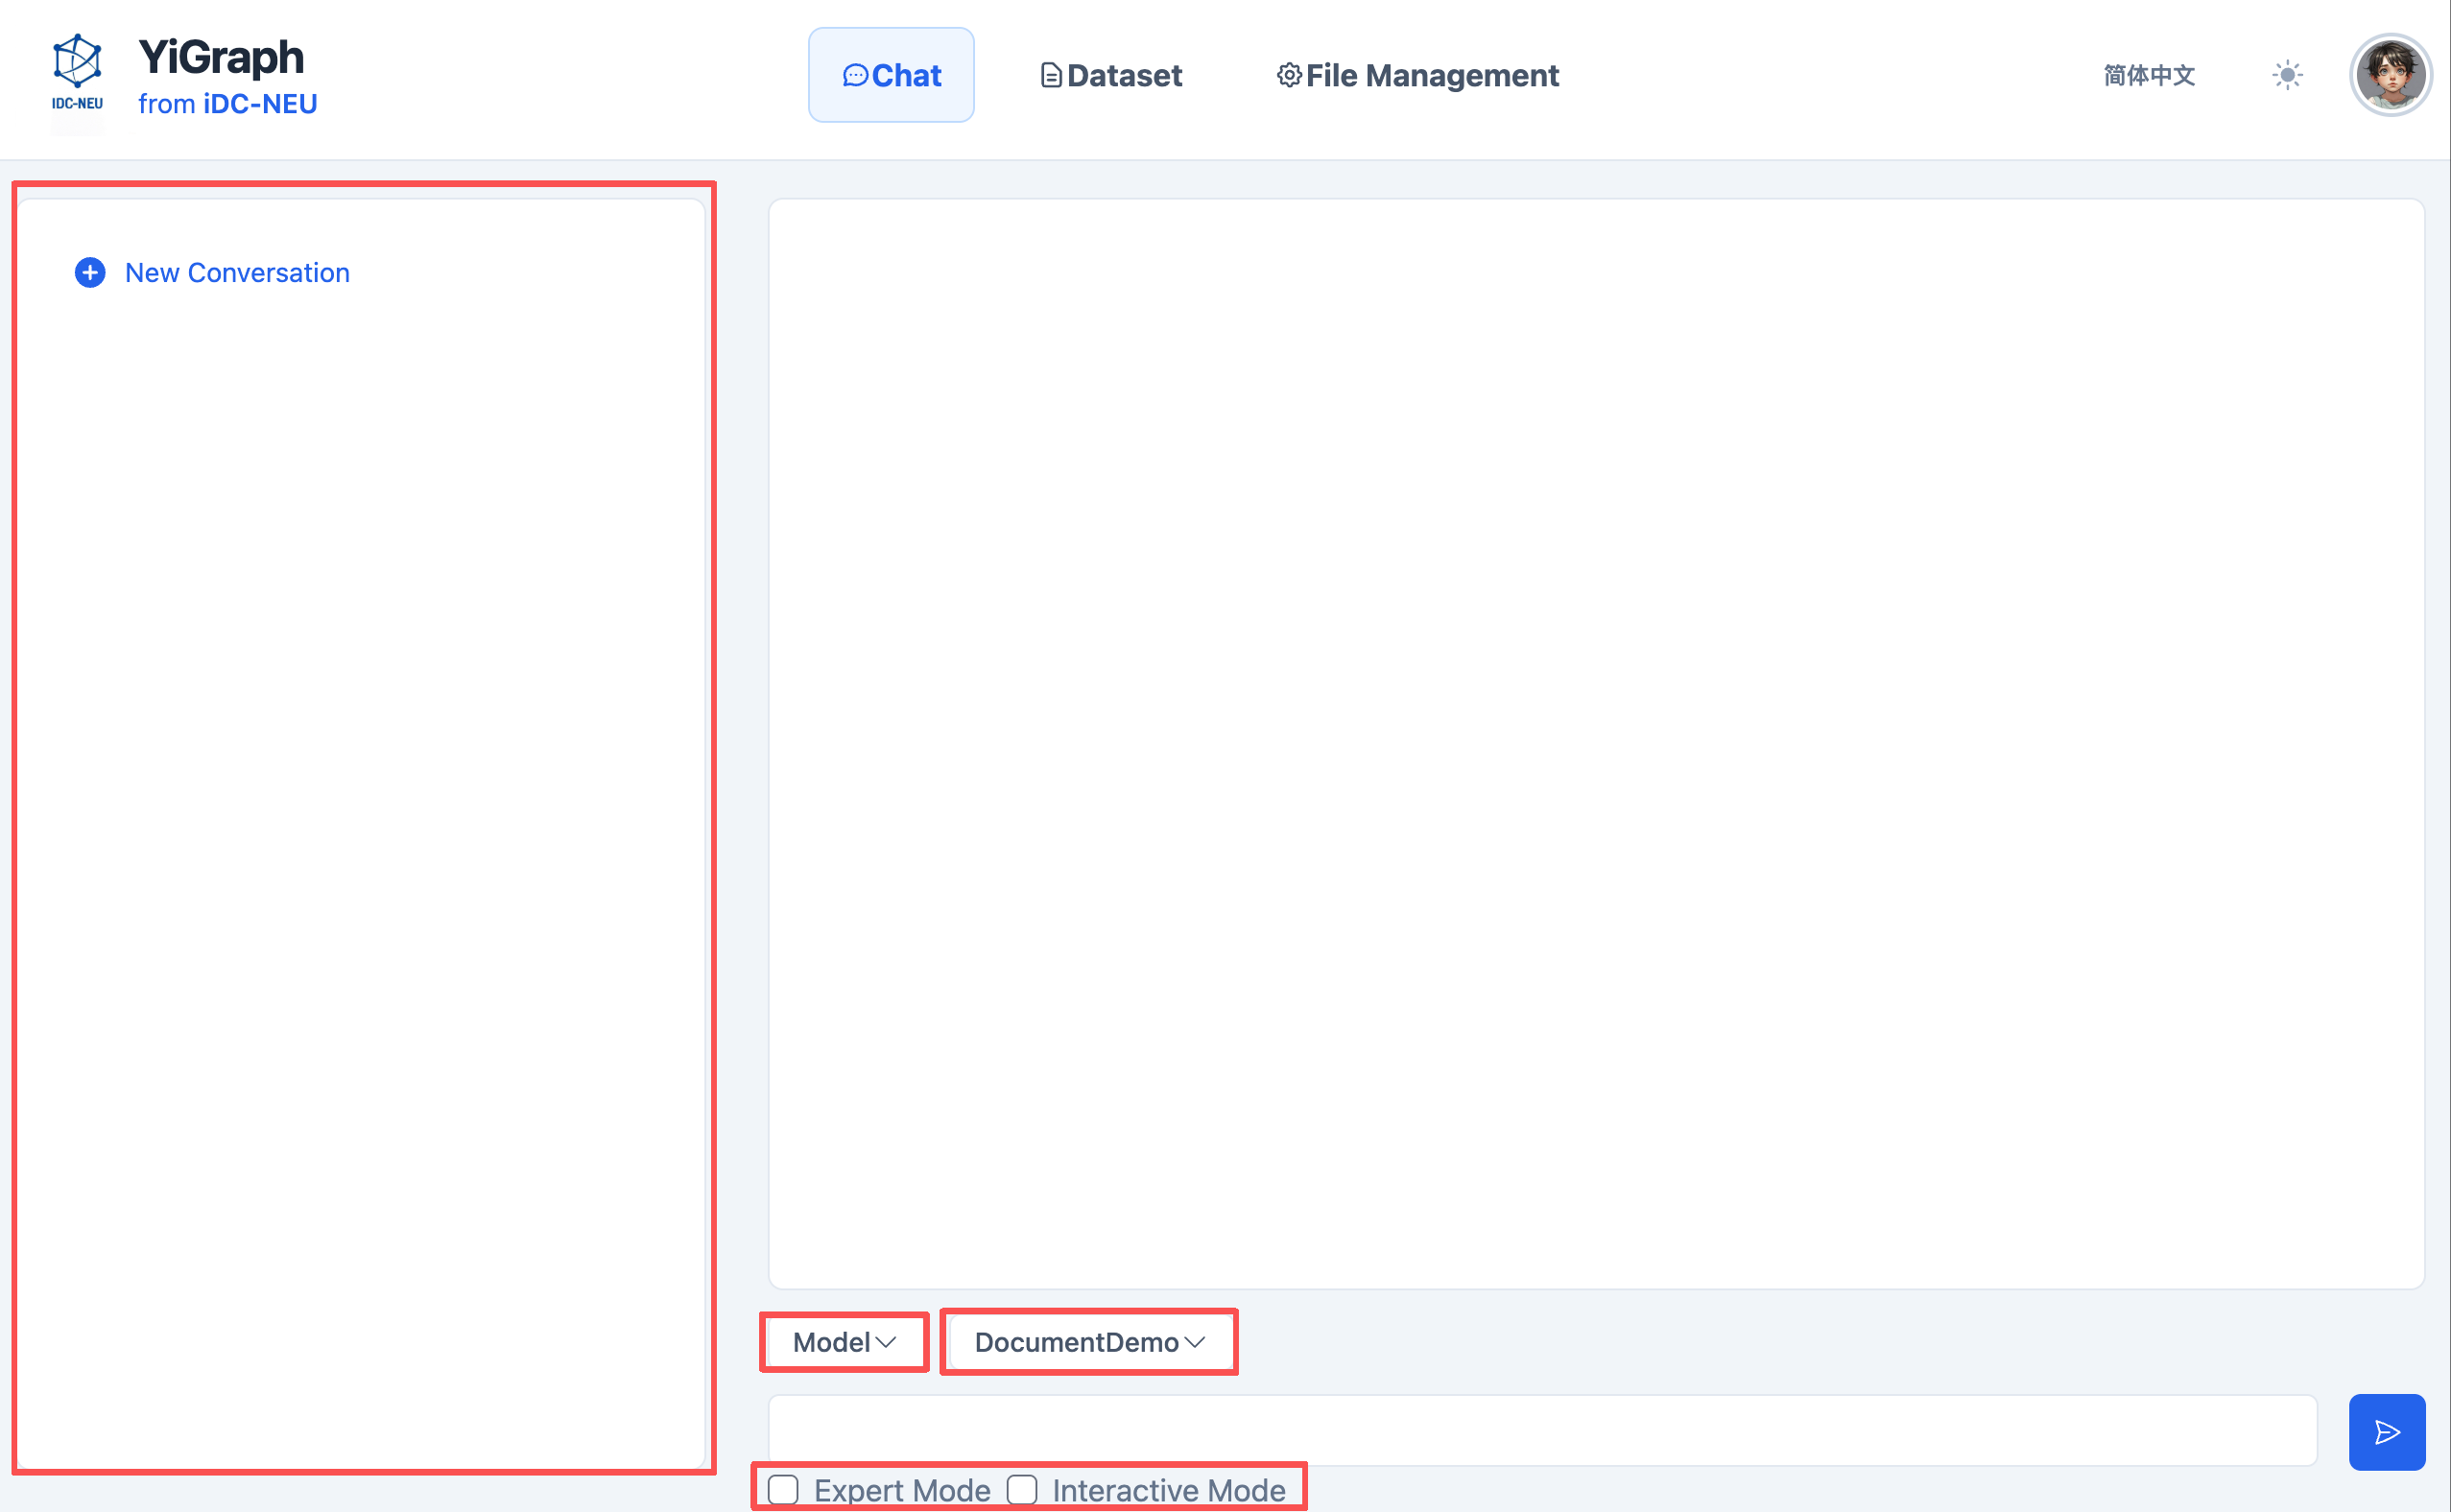
Basic steps for using the YiGraph web interface for analysis:
-
Start Conversation: Start a new conversation or select an existing conversation from history.
-
Select Mode: Choose the mode that best suits your needs.
-
Select Dataset: The system will list your uploaded datasets. For example: DocumentDemo.
-
Enter Your Request: Type your instructions or questions in the input box. Please be as clear and specific as possible.
-
Submit: Click the send button.
-
Monitor Progress: Observe status updates in the main chat area (Running, Planning, Analyzing, etc.).
-
View Results: After processing is complete, results will be displayed in the main chat area. You can then ask follow-up questions or start a new request.
Dataset Management
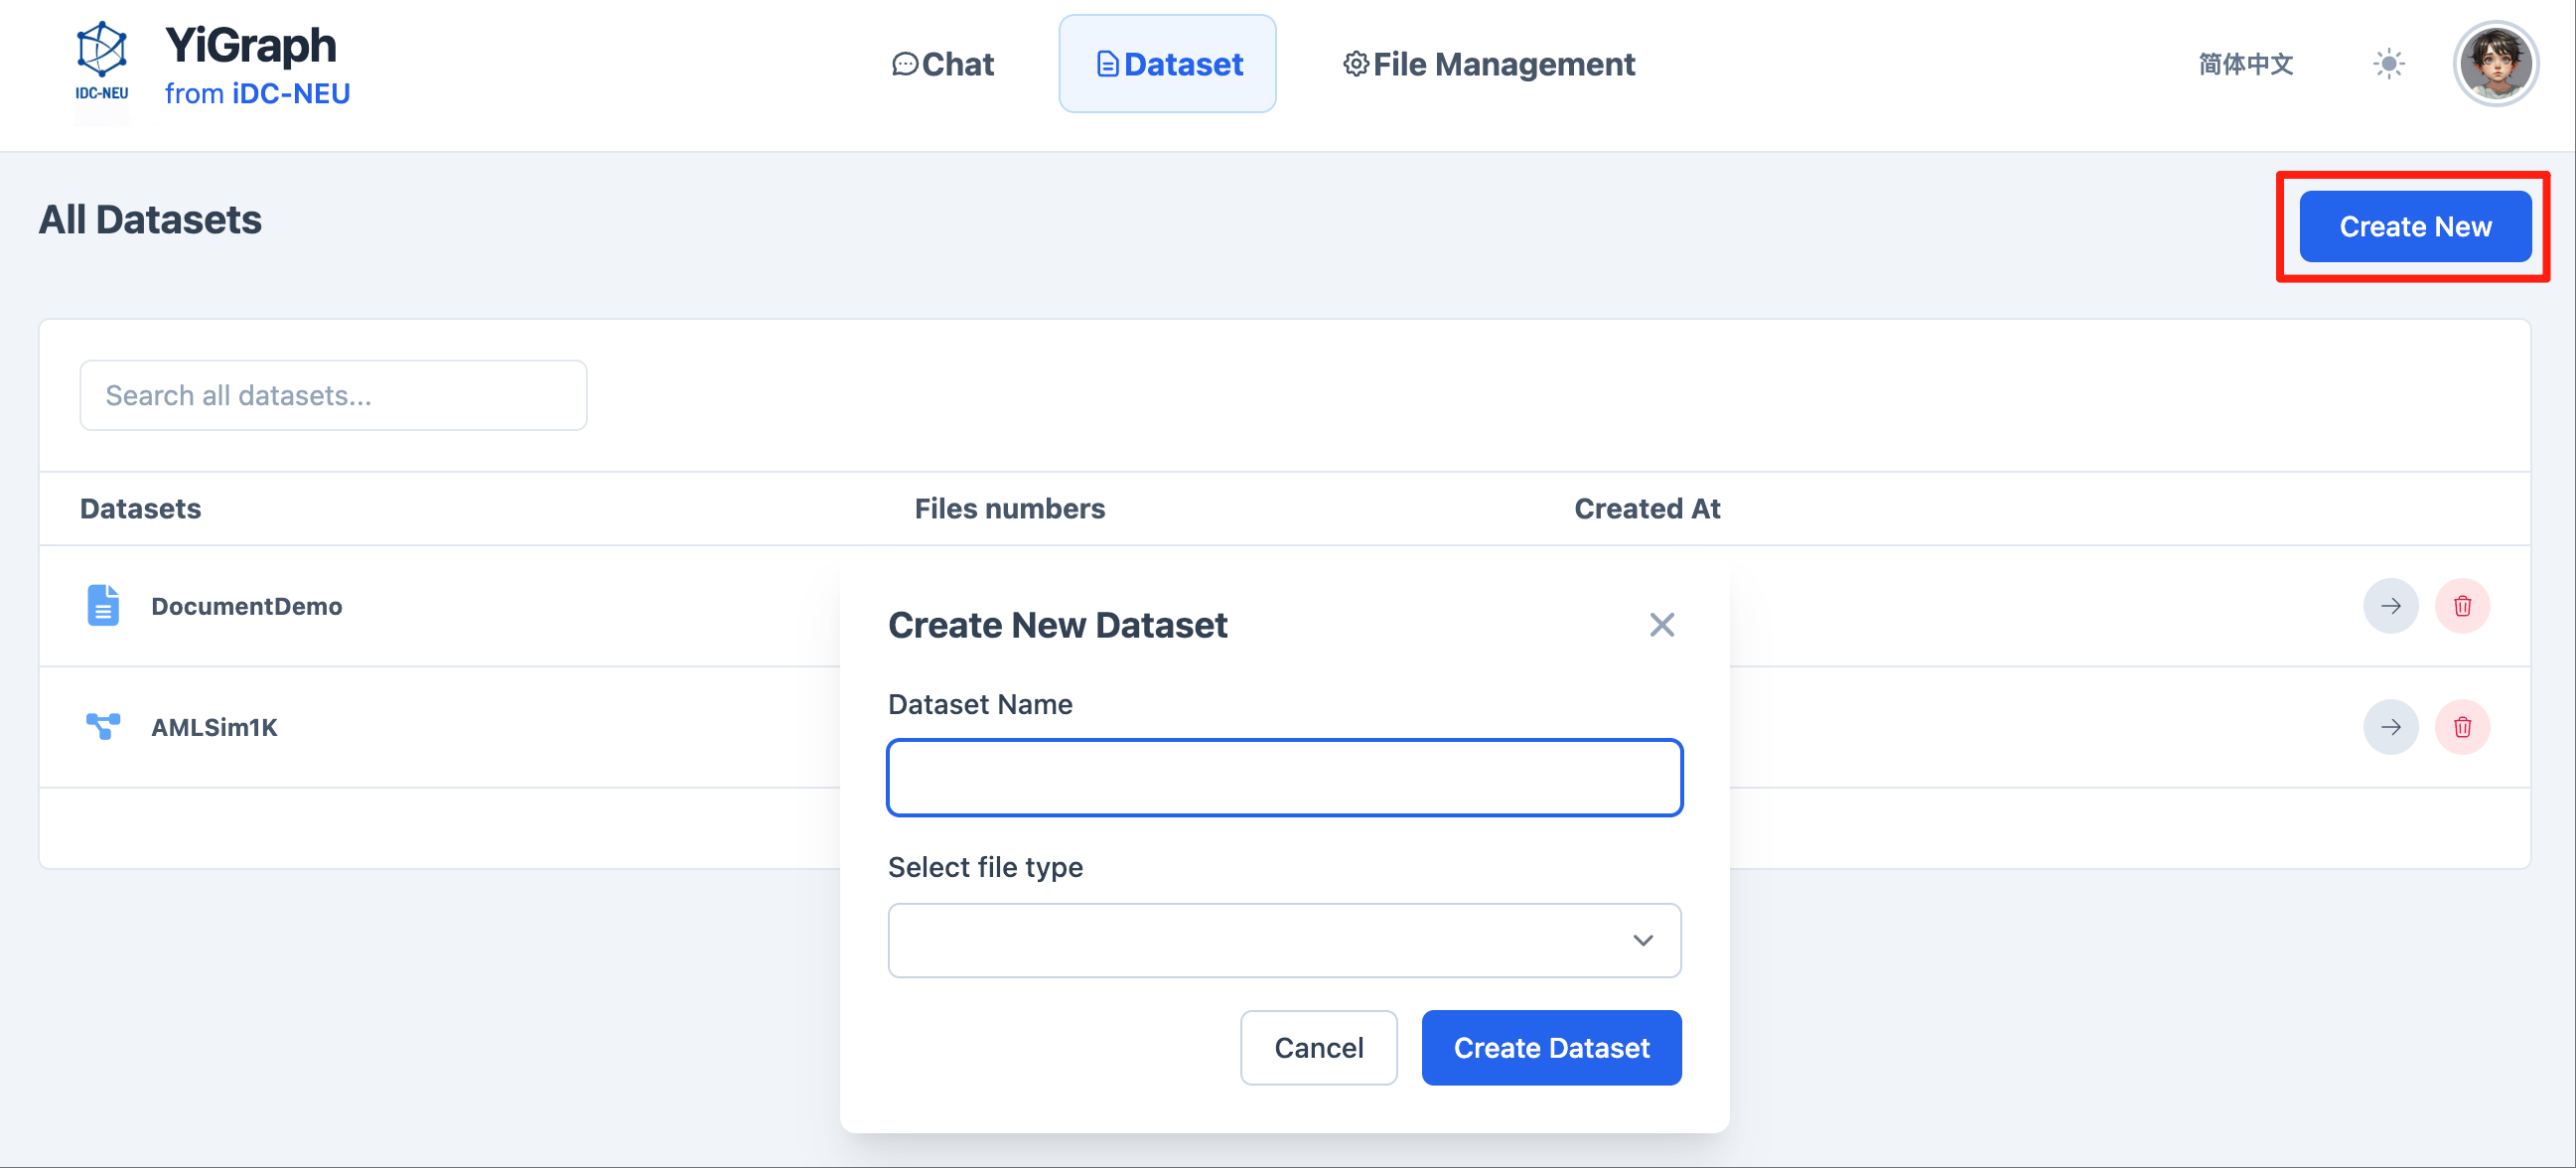
In the web interface, you can conveniently manage datasets:
-
Create Dataset: Click the "Create New" button.
-
Fill in Dataset Information:
- Enter the dataset name
- Select the file type for the dataset
-
Upload Data Files: Upload corresponding data files based on the selected file type.
-
Save Dataset: After completing the configuration, save it. The dataset will be available for selection in conversations.
File Management
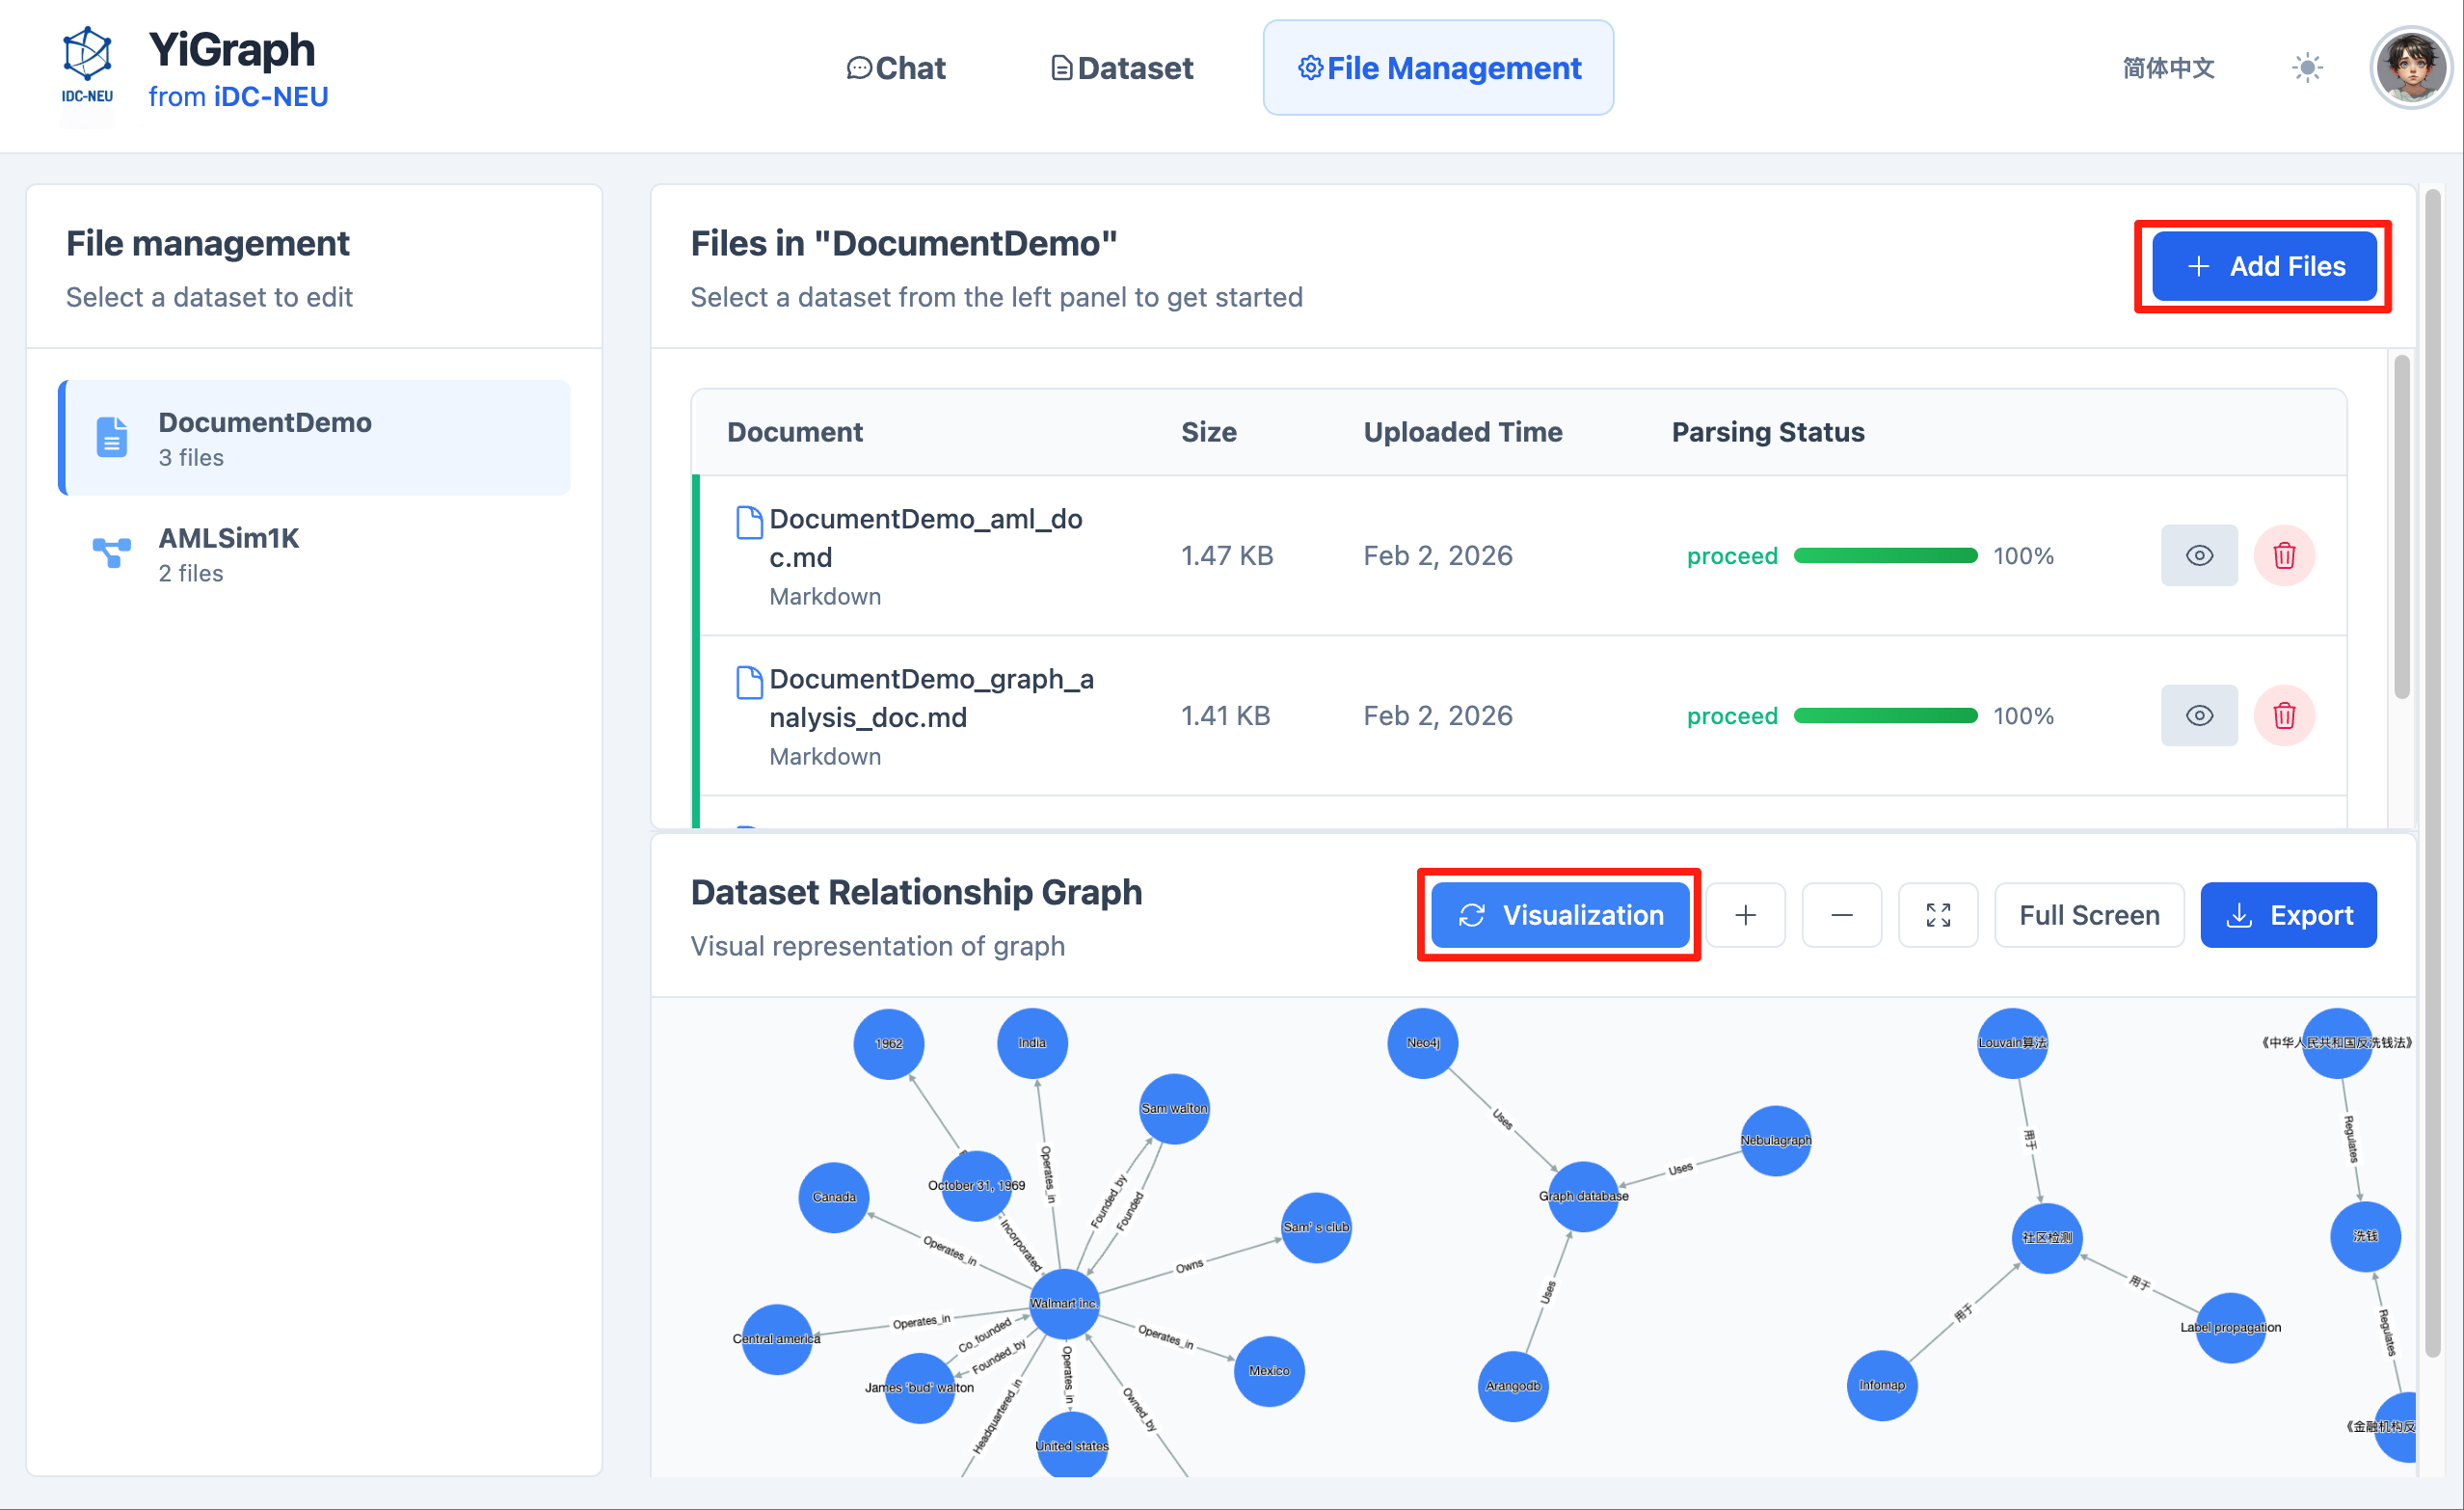
In the file management interface, you can manage and visualize files in datasets:
-
Select Dataset: Choose the corresponding dataset from the dropdown list.
-
Upload Files: Upload files to the selected dataset.
-
View Parsing Progress: The system will display file parsing progress and provide real-time status feedback.
-
Visualize Knowledge Graph: After file parsing is complete, click the "Visualization" button to view the knowledge graph visualization for that dataset.
4.2 Terminal Interactive Mode
If you want to interact with YiGraph directly through the command line, execute in the project root directory:
python aag/main.py
After startup, the system will enter terminal interactive mode. Users can input questions according to terminal prompts, and YiGraph will complete the analysis and output results in the command line.
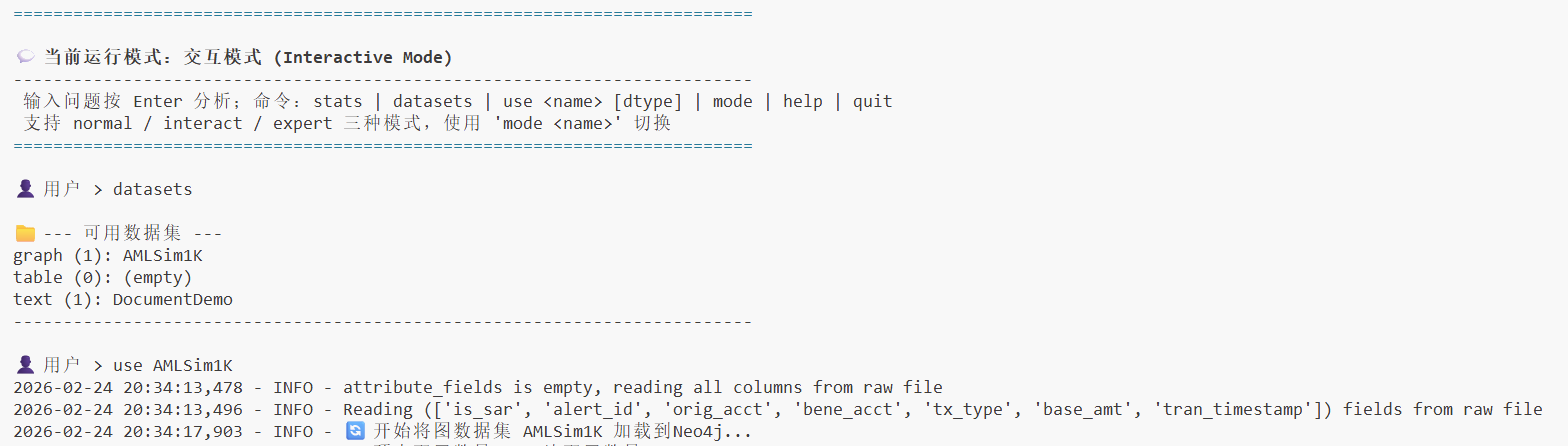
Terminal Interactive Usage Guide
Basic steps for using terminal interactive mode:
-
View Available Datasets: Use commands to view available datasets in the system.
-
Select Dataset: Select the dataset you want to use according to the prompts.
-
Enter Questions: Directly input your business questions or analysis requirements in the terminal.
-
View Results: The system will display the analysis process and final results in real-time in the terminal.
This mode is mainly used for development debugging, algorithm verification, or quick testing scenarios.
5. Using YiGraph
Regardless of whether you use Web mode or Terminal mode, the basic usage process of YiGraph is consistent:
-
Start the corresponding running mode
-
Input natural language business questions according to prompts
-
The system automatically completes task understanding, analysis execution, and result generation
For more advanced features, parameter descriptions, and usage examples, please refer to the project's README documentation or operation prompts in the interface.
6. Common Issues and Suggestions
- GPU device unavailable: Please confirm that
embedding.deviceis set correctly - Port conflict: Check if graph database and vector database services are started
- Model cannot be loaded: Confirm that API Key and model name are valid
For batch mode, more model configurations, or advanced usage, please further consult the official documentation or source code comments.